
Natural and driven oscillations
Experiment
The schematicall experimental arrangement of the remote experiment Natural and driven oscillations is depicted in Fig. 0.
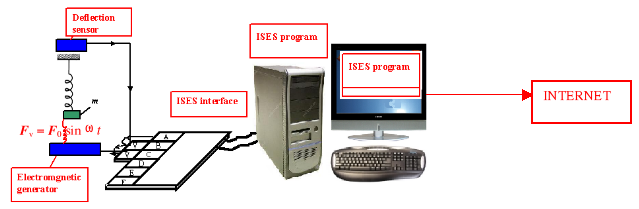
Figure 0: The arrangement of the remote experiment of the natural and driven oscillations
The aim of remote experiment is to allow to the experimentator observe and even measure damped and driven oscillation of spring
and to explain all its properties, interesting facts and characteristic physical quantities.
Use of this experiment is wide – determination of angular frequency of harmonoci oscillator, damping ratio,
resonance, phase and amplitude, transformation of energy from the source of driven force on oscillator. Try mesauring!
View on title page of remote experiment Natural and driven oscillations
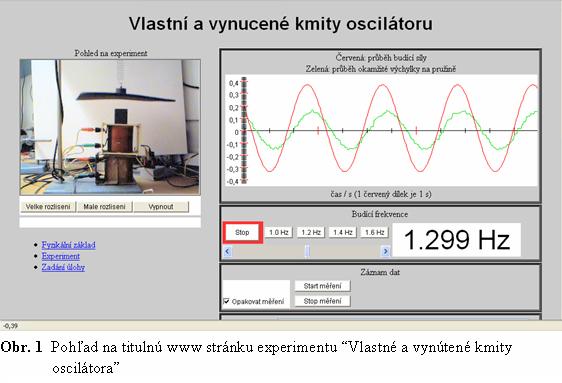
2. Look carefully at the www page, where you can find:
- online web camera, which provides online realtime view on the experiment, which is situated in laboratory of Charles University in Prague, Faculty of Mathematics and Physics. The camera has two resolutions and swtich to turn on/off. Higher resolution increases amount of transfered data. Can you see the difference between those resolutions?
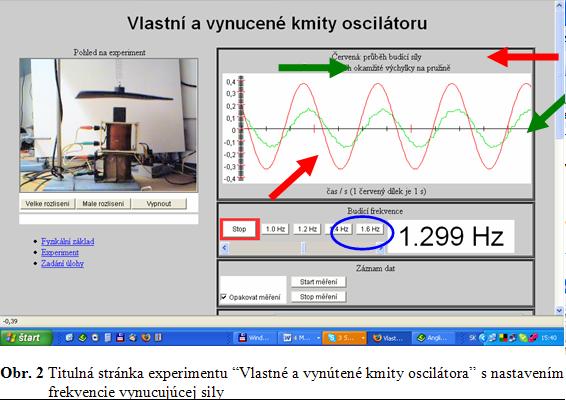
- web page allows control of the experiment by changing frequency of electromagnetic generator, which produces outer periodic driven force,
which affects the body of mass m. Set up the frequency. There are two posibilities
- you can choose from set of predefined frequencies by clicking on buttons with their values: 1.0, 1.2, 1.3, 1.4 Hz and the stop button
- by using slider (continuous change) in allowed interval, see fig. 2
- Observe time dependence of driven force for various frequencies (red curve and arrow in fig. 2)
- Observe time dependence of instantaneous position for various frequencies of driven force (green curve and arrow in fig. 2). Can you see some changes? Describe them using words. Can you quantify their differences with mathematical expressions? If not, return to the theory and see equation 3.
Title page of experiment Natural and driven oscillations - configuration of frequency of driven force
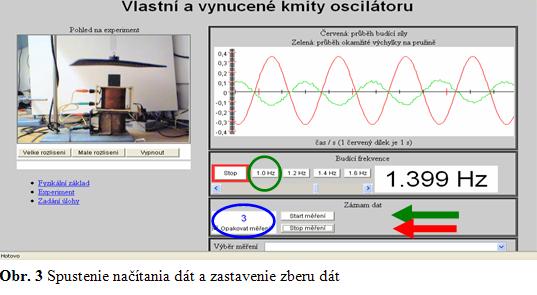
Data record
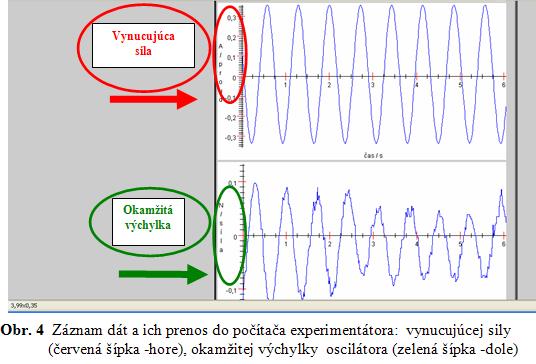
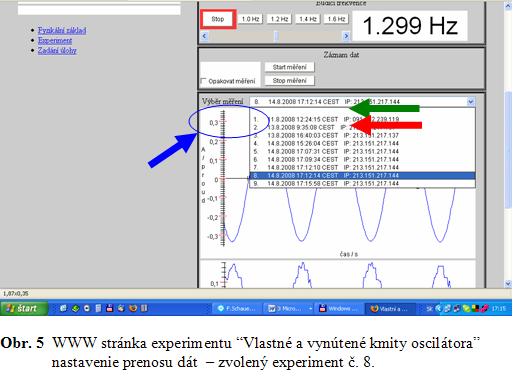
You can observe realtime dependencies of instantaneous position, you have also possibility to record the data and save them,. To do that, press button "Start recording" (green arrow, fig. 3), after you finish your measurement, press "Stop recording" (red arrow, fig. 3). Then you are able to see both measured time dependences: driven force – top window, instantaneous position – bottom window (fig. 4). The number 3 (on your PC it will be different) in left window (fig. 3) marks number of experiment and its data. You can download data measured by other experimentators, e.g. measurement no. 8 on fig. 5.
Start / stop recording measured data
Data record and transfer to client PC: dirven force (red arrow in the top) and instantaneous position (green arrow in the bottom)
Export of measurement data to experimenatotr's PC
Drop down the recorded measurement list, choose number of experiment, which you wish to export and choose the data format (Comma separated values, Values for Excel). Press the button and a new window with data in chosen format will appear. (check whether you have allowed pop-ups for the experiment site). If you check the option Repeat experiment (fig. 5 – blue arrow), you don't have to select numer of experiment (it will be the same for all) and measured data is in your PC (fig. 6).
Web page of the experiment Natural and driven oscillations, configuration of data transfer - chosen experiment no. 8
Web page with exported data as "Comma separated values"
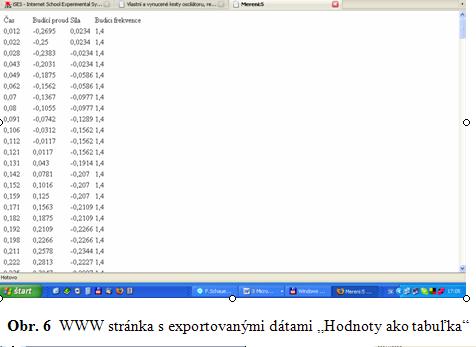
When the pop-up window appears, Press Ctrl + A to select them all, Ctrl + C to copy and Ctrl + V to paste them in your program (e.g. Excel). Paste the data in table and create chart. The data are sorted in four columns: time, excitation current, driven force and instantaneous position (fig. 6).
Note:
Next processing is followed by experimentator itself. Suggestion of processing of experimental measurement can be found in experiment sections. In following section we will show you chosen measurements, which were realized in auxiliary scientific work on University in Trnava by student Pavel Mejerčík in academic year 2007/08.
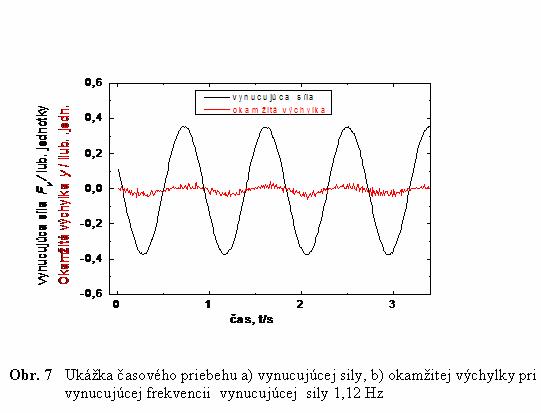
Time dependence: driven force (black) and instantaneous position (red), frequency of driven force is 1.12 Hz
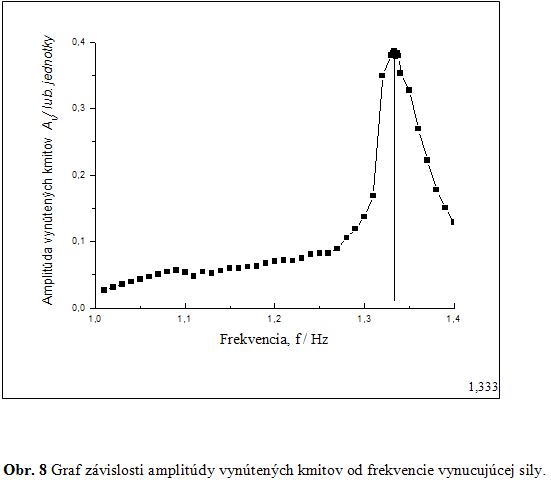
From measured values we can create graph - dependence of driven oscillations amplitude on driven force frequency (fig. 8) using arithmetic means of amplitudes for certain frequencies of driven force. From there we are able to obtain the resonance frequency. Highest value of amplitude coresponds to resonance frequency 1,333 Hz.
Dependence of amplitude driven oscillations on frequency of driven force
Time dependence of driven oscillations instantaneous position
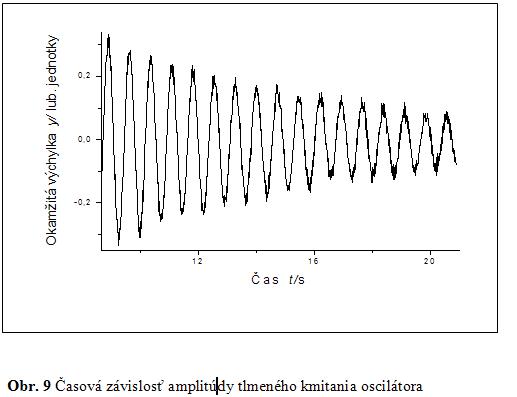
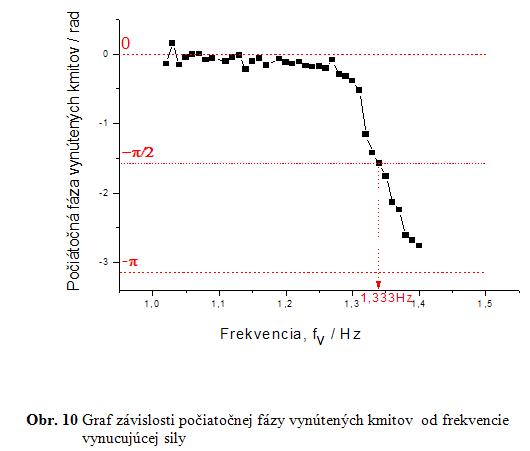
With proper process of graph and with use relation An = A0exp(-bnT), where A0 is the amplitude in time t = 0 s and n is the count of periods, we get that for t = 0 s is A0 = 0,3279 ľ.j, for 17 periods je A17 = 0,0838 ľ.j., so the coefficient b can be determined: b = 0,117 s-1. One of the most important result is resonance. E.g. it is interesting to study dependence of φv on driven angular frequency ωv. Results of measurement are shown in fig. 10. From the graph we can see that initial phase of oscillations is function of angular frequency of driven force, and its values lie in the interval (0,-π). When the frequency is reconance frequency fv =1,333 Hz then the initial phase of driven oscillations is –π/2.
Dependence of initial phase of driven oscillations on frequency of driven force
Author (in Czech language): doc. RNDr. Miroslava Ožvoldová, PhD.