
Спектры
Experiment
Open the university students user interface.
| Web-cam | Rotating mirror (Lamp selection) | |
|
Focusing len Optical fibre |
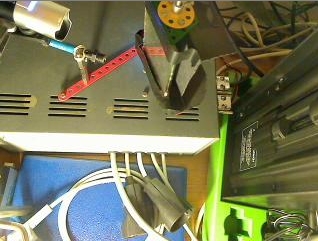
|
Geissler tube filled with Hydrogen (+ HV Power Supply) |
| Mercury lamp |
Necessary user's equipment (client PC):
- Up-to-date JAVA Runtime Environment (JRE) installed for the view and control of the experimental setup.
- Common web-browser (MS Explorer, Mozilla Firefox, ...).
- Fast and stable internet connection.
After you have finished your measurement (or have been waiting in a queue), please do not forget to close the web/browser window, otherwise the RCL is blocked for other users. The connection state line (in the left upper corner) gives you the information about other users waiting in a queue and the estimated period of time for your waiting or control of the exp. setup. Empty line means you are connected to the server alone.
All the measured spectra are displayed in the spectrum overview graph until the Clear graph button is pressed, so that you can compare the spectra.
While the output state is signalized, the data are recorded since the start recording button has been pressed until the stop recording button is pressed. With these buttons a user can record only the desired part of the spectrum. The data are valid within the wavelength range 350–1000 nm due to installed cut-off filter.
How to download your experimental data?
- Select the record ID in the menu and you can check in in the overview (data transfer may take 1 s up to 1 min)
- Press the Export data button.
- The data will appear in a new pop-up window if they are not blocked by your web browser, otherwise you need to change the web-browser settings, or enable pop-ups for this operation in the warning message window. Then you need to press the Export button again.
- In active pop-up window with data press Ctrl+A, Ctrl+C, open a MS-Excel-like document and insert the data by Ctrl+V.
Equipment:
- Geissler tube filled with Hydrogen (with High Voltage Power Supply 1,2 kV, 12 mA). Mercury lamp.
- Rotating mirror for the lamp selection. (Hydrogen spectrun without the mirror.)
- Spectrometer: focusing len, optical fibre, diffraction grating 300 grooves/mm, collimation len, detector ILX–511B with cut-off filter transmitting in the range 350–1000 nm. Theoretical resolution: 1,5 nm.
- Measure-server and web-cams.