
Солнечная преобразования энергии
Руководство эксперимента
The purpose of the experiment is to measure I - U characteristic of a photovoltaic cell in the dark and under the illumination.
- Click on the remote experiment.
- A page with the experiment appears (Fig.1). Please be patient while the experiment will be connected and data loaded. If somebody is already measuring and the experiment is occupied, wait for another 5 minutes. The reservation system is under construction and not available yet.
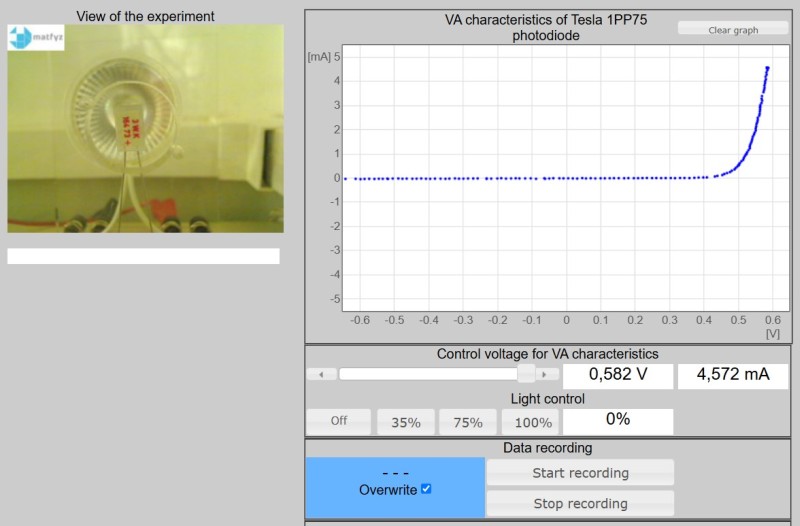
Figure 1 The front www page of the experiment Solar energy conversion Characterisation of photovoltaic solar cell characteristics - Go carefully through the www page. You can find there:
Web camera view
of the remote experiment laboratory in Prague; two resolutions and off of the camera are available with different requirements on the data transmission (see Fig. 2 and with the dark I-U characteristics of the diode) (the higher resolution means higher data rate requirements), choose one of them. Can you see the difference?Light intensity
Light intensity may be adjusted by means of three controls labelled 40 %, 60 %, 100 % and the control Off. (Fig. 2)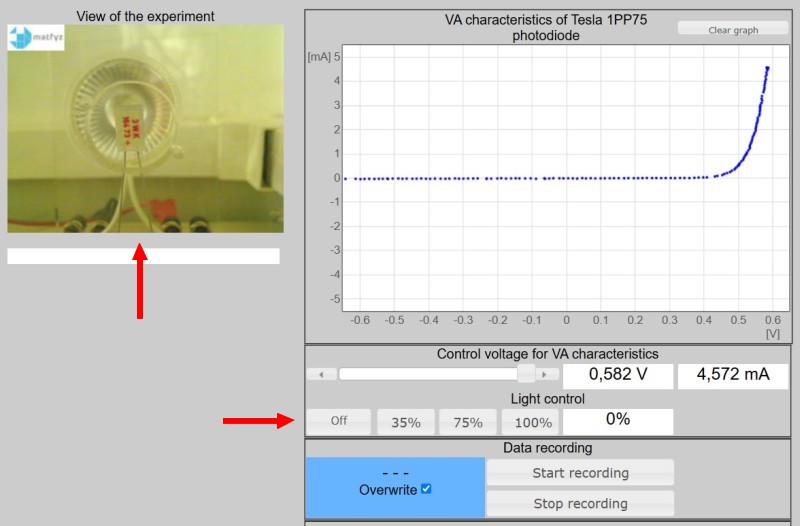
Figure 2 The www page of the experiment Characterisation of Photovoltaic Solar Cell. Web camera and light intensity controls are highlighted
The measurements of the I-U characteristics
The cell voltage may be adjusted by means of the movable control from -0.5 V to +0.5 V and simultaneously both the voltage U and current I are displayed and the points of the corresponding I-U curve occur (see Fig. 3 and the I-U characteristics in dark). Of course, you can delete the graph by means of control Delete graph.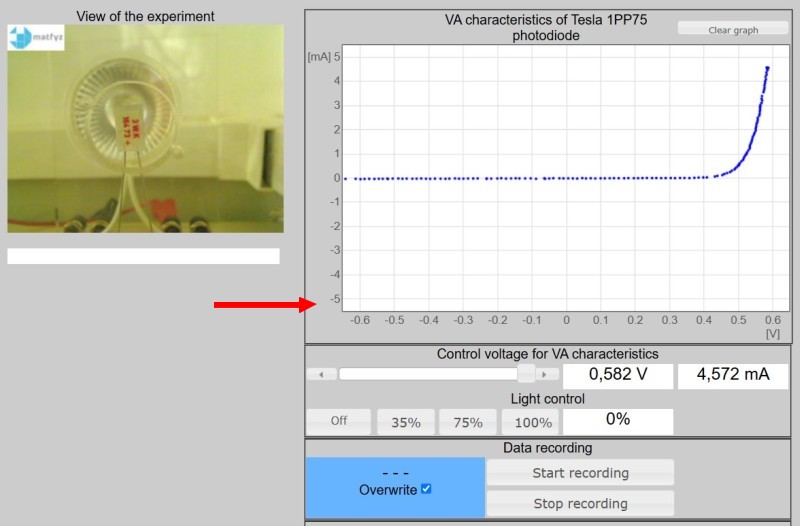
Figure 3 The www page of the experiment Characterisation of Photovoltaic Solar Cell with the measured points of the dark current I - U characteristics and voltage adjustment control with the display of the actual voltage U and current I of the cell
Data recording
(Fig. 3). If you want not only to display, but also to store the data, you have to apply before the measurement in question the control Start of recording and after the measurement the Stop of recording, then the measured data appear on the lower panel (Fig. 4).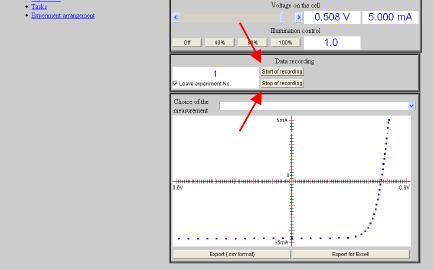
Figure 4 Example of I-U measured characteristics of the photovoltaic cell in light with light intensity L (L is the maximum light intensity, also 0.6L and 0.4L is possible to adjust ); the controls Start of recording and Stop of recording are highlighted
If you want not only to display, but also store the data on the server, you have to chose The choice of the number of measurement (in Fig. 3 it is No 1), or you may leave the previous number and rewrite the already recorded data.
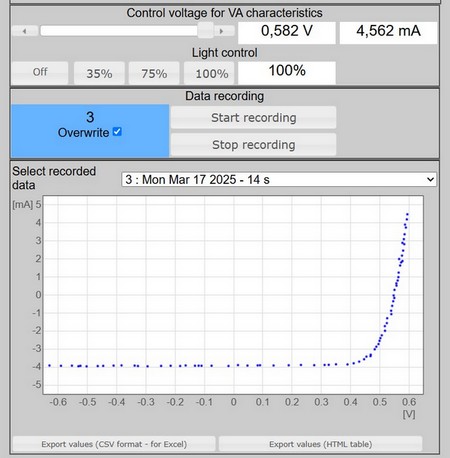
Figure 5 Example of the recorded I-U characteristics, corresponding to Fig.4 in light
Export of the measured data
If you want not only see, but also want the measured data (for subsequent processing) then apply before the measurement the control Start of recording and after the measurement the Stop of recording then the another graph corresponding to the measured and exported I-U curve (it is as a matter of fact the copy of the upper panel) appears in the lower panel (see Fig. 4).
The transfer of the measured data appears after you press the control of your choice (Export .csv format or Export for Excell). The data in the table (see Fig. 5) are arranged into columns giving the average voltage, the average current, the number of repeated measurements and the mean quadratic deviation of measured voltage and current, see Fig. 5. Then collect the data by a standard technique (copy and paste) and then copy to Excel, or any other graphical processors for plotting and/or data processing.
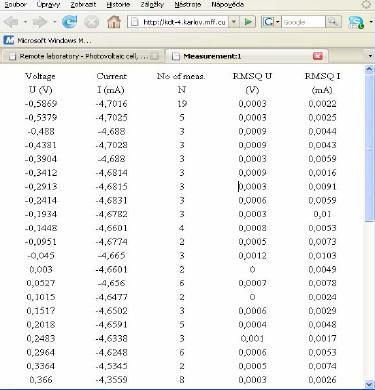
Figure 5 Example of the transfer of the measured data, corresponding to Fig. 4 and Fig. 5 in order the voltage, the current, the number of measurements taken and the mean quadratic deviation of the measured voltage and current